Introducing Aplot
Posted: April 14, 2017 Filed under: Aplot, Tips and Tricks Leave a commentWith the release of version 2.36, Simply Fortran now includes Aplot, a library for creating simple, two-dimensional plots and charts directly from Fortran. The programming interface provided is designed to be straightforward, and the library is available on Windows, macOS, and GNU/Linux. This short article will walk through creating a non-trivial plot quickly with Aplot.
For this example, we’ll attempt to plot 1000 random, uniformly distributed numbers along with a running mean as the sample size grows. The plot will therefore include scatter elements and a line, both with a significant amount of data.
In order to use Aplot, the aplot module must be employed in a given procedure:
use aplot
On Windows and macOS, this module will be seamlessly included. On GNU/Linux, Simply Fortran might show the module as unavailable until you click Build Project for the first time. There are no other steps to take; Simply Fortran will automatically detect this module’s inclusion and configure the compiler to link to the aplot library.
To generate our data set, we’ll need to populate some arrays accordingly. The code below should be sufficient:
    real, dimension(1000)::x, rand_y, mean_y
    integer::i

    call RANDOM_NUMBER(rand_y)

    do i = 1, 1000
        x(i) = real(i)
        mean_y(i) = sum(rand_y(1:i))/x(i)
    end do
The above code creates three arrays. Our X-axis data will just be the sample count, though we have to use a REAL variable with Aplot. The random data is created with a single call to RANDOM_NUMBER, which populates the entire rand_y array in one call.
The x array is manually populated inside the loop along with the calculation of a running mean in the mean_y array. This code generates two datasets that we need to plot.
In order to create a plot, we need to define a plot variable, which is of the aplot_t type:
type(aplot_t)::plot
This variable is used for defining all aspects of our plot at eventually displaying it. Before we can use it, though, we must initialize it:
plot = initialize_plot()
Once initialized, we can define some aspects of our plot:
    call set_title(plot, "Uniform Random Numbers")
    call set_xlabel(plot, "Sample")
    call set_ylabel(plot, "Value")
    call set_yscale(plot, 0.0, 1.2)
Most calls above are straightforward, and each requires our plot variable as its first argument. The final call, though, to set_yscale might not be as obvious as setting titles and labels. By default, Aplot autoscales both axes. In this case, though, we know the data on the y-axis will fall between 0 and 1. In order to provide a little extra space, we’ll expand the plot slightly so that the y-axis varies from 0 to 1.2.
The next step is to configure each dataset for the plot. To add data, we must pass an X and Y array to the add_dataset subroutine:
call add_dataset(plot, x, rand_y)
Once we’ve provided the first dataset to the plot, we can assign some attributes to the series:
    call set_seriestype(plot, 0, APLOT_STYLE_PIXEL)
    call set_serieslabel(plot, 0, "Random Number")
The call to set_seriestype configures the style of the series when drawn. The index of zero is passed because Aplot uses 0-indexing for its series identification. In this case, since we’ll be showing 1000 points, we’ve asked for it to be drawn as a scatter plot using single pixels; the user can also use larger dots, lines, or bars to represent a series. The second call to set_serieslabel provides a label for this series in the legend.
Our second dataset, the running average, can be configured similarly:
    call add_dataset(plot, x, mean_y)
    call set_seriestype(plot, 1, APLOT_STYLE_LINE)
    call set_serieslabel(plot, 1, "Running Mean")
Our plot is now entirely ready to display. The final step is to call:
call display_plot(plot)
which opens a window displaying the complete plot.
The final coding step is to clean up our plot after the user closes it. While not necessarily important in a standalone program, a subroutine that generates plots should always perform final cleanup before exiting. The simple code is:
call destroy_plot(plot)
After this call, all memory associated with the plot is released, and the program can continue normally.
The code here should compile in Simply Fortran 2.36 without issue, generating the following on GNU/Linux:
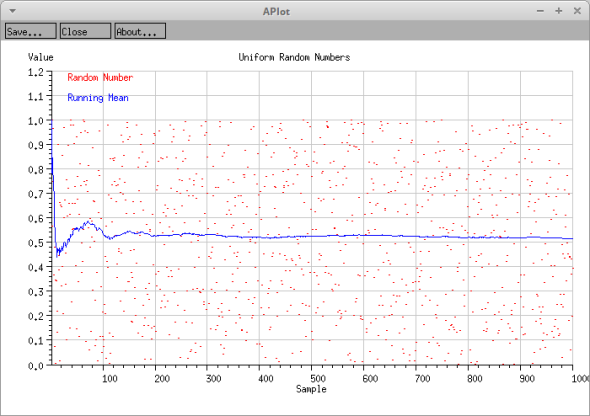
While the plot might look slightly different on macOS or Windows, it should still resemble the above chart. The plot shows the running average, in blue, converging towards 0.5 as more samples are considered.
Hopefully the above helps users get started with Aplot. The interface is designed for quickly and easily adding plots to Fortran. Any questions about how it works can always be posted on our forums, where either Approximatrix or another user will happily help out.
The complete code for this example is below:
program ranmean
use aplot
implicit none

    type(aplot_t)::plot

    real, dimension(1000)::x, rand_y, mean_y
    integer::i

    call RANDOM_NUMBER(rand_y)

    do i = 1, 1000
        x(i) = real(i)
        mean_y(i) = sum(rand_y(1:i))/x(i)
    end do

    plot = initialize_plot()
    call set_title(plot, "Uniform Random Numbers")
    call set_xlabel(plot, "Sample")
    call set_ylabel(plot, "Value")
    call set_yscale(plot, 0.0, 1.2)

    call add_dataset(plot, x, rand_y)
    call set_seriestype(plot, 0, APLOT_STYLE_PIXEL)
    call set_serieslabel(plot, 0, "Random Number")

    call add_dataset(plot, x, mean_y)
    call set_seriestype(plot, 1, APLOT_STYLE_LINE)
    call set_serieslabel(plot, 1, "Running Mean")

    call display_plot(plot)

    call destroy_plot(plot)

end program ranmean
Multiple Windows with AppGraphics
Posted: June 26, 2015 Filed under: AppGraphics, Tips and Tricks | Tags: multiple windows, windows Leave a commentA number of users have requested some further information about handling multiple windows in AppGraphics. While the Fortran interface certainly suggests a multi-window program is possible, the details of such a program might be a bit non-obvious. In this tutorial, we’ll walk through creating a multiple window application.
To start this exercise, we’ll need a primary window from which we’ll spawn children. While this design isn’t strictly necessary, it would be a common model for many users. Since we’ve gone over producing such windows in the past, we’ll just post the contents of a “main window” below:
program main
use appgraphics
use children, only: child_ids, child_create_time, redraw_children
implicit none

    integer::myscreen
    integer::create_child_button
    integer::sc_ticks
    integer::sc_tick_rate
    real::time_now

    myscreen = initwindow(200, 130, closeflag=.TRUE.)

    ! Add a button for creating children
    create_child_button = createbutton(60, 80, 80, 40, "Create Child", &
                                       handle_create_child)

    ! Initialize the child index arrays
    child_ids = -1
    child_create_time = 0.0

    ! Label this as the main window
    call settextstyle(SANS_SERIF_FONT, HORIZ_DIR, 60)
    call outtextxy(15, 5, "Master")

    call system_clock(count_rate=sc_tick_rate)

    do while(.true.)

        ! Calculate the system time now in seconds
        call system_clock(count=sc_ticks)
        time_now = real(sc_ticks)/real(sc_tick_rate)

        ! Redraw all children and provide them with the system time
        call redraw_children(time_now)

        ! Set the master to the current window and idle 1 second
        call setcurrentwindow(myscreen)
        call startidle(1000)

    end do

    call closewindow(myscreen)

    contains

    subroutine handle_create_child()
    use children, only: create_child
    implicit none

        call create_child()

    end subroutine handle_create_child

end program main
Immediately, readers may notice an unfamiliar module, children, appearing at the beginning of this program. The children module will appear later in this writeup, and it will contain all the necessary subprograms for creating, managing, and destroying child windows.
In our main program, we first create a simple, single window that is labeled “Master” and has a single button labeled “Create Child.” Our goal is to spawn a child window whenever the user clicks said button.
After creating the window, we also initialize two arrays, child_ids and child_create_time, that are both used for managing child windows. The former array is used to maintain a list of the identifiers to all of our child windows. When a developer calls the createwindow function, a unique identifier to that window is returned; we need to explicitly keep track of these identifiers while our program is running to allow switching to and update child windows as necessary. The latter array just tracks the system clock time when each child window is created so that we’ll have something interesting to display in our child windows.
After all this initialization, our main program enters a simple loop. Within the loop, we’re calculating the system time in seconds and, using the time value, calling a subroutine to update all of our child windows. Once the update is complete, we carefully ensure the current window in AppGraphics is our main window and we idle for one second. Setting the current window is quite important in AppGraphics. Had we not set the current window to our master window prior to calling startidle, our idling loop would be applied to another window. Basically, as a rule of thumb in AppGraphics programs, any sequence calls to AppGraphics should be preceded by a call to setcurrentwindow to ensure the calls are being applied to the proper window. Without this step, it becomes quite easy to crash your program by attempting an operation, drawing, idling, or querying, on a window that no longer exists.
So far we’ve covered the easiest parts. Handling our child windows will be somewhat more complicated. To start, we’ll need to store some data within our children module:
module children
implicit none

    ! Allow no more than 32 windows
    integer, parameter::max_windows = 32

    ! Width and height of our child window
    integer, parameter::wc = 180
    integer, parameter::hc = 80

    ! Array of child window ids and the system times at which each was created
    integer, volatile, dimension(max_windows)::child_ids
    real, volatile, dimension(max_windows)::child_create_time

contains
...
We have a parameter that defines the maximum number of children we’ll allow; thirty two seems like a reasonable limit. We also define some parameters regarding drawing. The interesting data, though, are our two tracking arrays, child_ids and child_create_time. We’ve marked both arrays as “volatile” because there is a possibility the data in these arrays may be accessed by multiple threads.
Next, we need a subroutine to create a child window:
    subroutine create_child()
    use appgraphics
    implicit none

        integer::child_index
        character(40)::title
        integer::close_button

        ! Loop to find an available slot
        do child_index=1, max_windows

            ! If the array of children is a negative one, it is available for
            ! storing a child id
            if(child_ids(child_index) .EQ. -1) then

                ! Create a title for this window
                Write(title, '(A5,1X,I3)') "Child", child_index

                ! Create the window, making sure that "closeflag" is false
                child_ids(child_index) = initwindow(wc, hc, &
                                                    title=title, &
                                                    closeflag=.FALSE.)

                ! Set up some styles for this window
                call settextstyle(WINDOWS_FONT, HORIZ_DIR, 8)
                call setbkcolor(BLACK)
                call setcolor(WHITE)

                ! Store a zero as "when it was created" for now
                child_create_time(child_index) = 0.0

                ! One button to close this child
                close_button = createbutton(wc-50, hc-40, 40, 30, &
                                            "Close", close_child)

                exit

            end if
        end do

    end subroutine create_child
This routine starts with a loop that looks through our child_ids array for an entry that is equal to -1. We’ll use a -1 to represent an empty slot in our child ids array; one might recall that we initialized the ray to-1 appropriately in our main program. When we do find a -1, we’ll proceed with a call to createwindow and store the new window’s identifier in the child_ids array. For fun we also create a title with the window’s index in the child_ids array. There is some basic graphical configuration of this new window as well. With our new window, we’ll save a creation time of 0.0 in the second array. Finally, we’ll add a close button.
Readers might notice that we’ve already violated a rule mentioned earlier concerning calling setcurrentwindow prior to calling a sequence of AppGraphics routines. The only reason we’ve skipped this step is that the createwindow function also implies setting the current window to the latest window.
For our “close” button, we’ve attached the button to a subroutine named close_child. This routine requires some consideration here:
    subroutine close_child
    use appgraphics
    implicit none

        integer::child_id
        integer::child_index

        ! This call determines the id of the window that executed this
        ! callback
        child_id = getsignallingwindow()

        ! And we'll retrieve theindex of this window in our global
        ! arrays
        child_index = index_from_id(child_id)

        ! Mark this chold window slot as available for a new child
        if(child_index .GT. -1) then
            child_ids(child_index) = -1
            child_create_time(child_index) = 0.0
        end if

        if(child_id .GT. -1) then
            call closewindow(child_id)
        end if

    end subroutine close_child
To close a child, we need to take a few steps. First, we need to determine in which window the close button was clicked. All of our child windows call this routine, so we have to determine which to act upon. The getsignallingwindow function can be used to determine the id of the window from which the callback was made. Once we have the id of the child window, we’ll call another custom function to determine the index of this child in the child_ids array. The index_from_id is a simple array search, so we’ll ignore it in this writeup, although it appears in the complete source code.
The reason we need the index in the child_ids array is to set the entry for said window in the array back to -1 so that the slot is once again available for creating a new window.
Finally, we can close our window with a call to closewindow, explicitly passing the id of the window we’re closing.
At this point, we do indeed have a program with multiple windows, but none of the children do anything. To make this exercise interesting, we’ll perform some updates to our children. One may recall that our main program called a subroutine redraw_children that accepted a time argument. This subroutine will subsequently be used to call a redraw routine for all our children:
    subroutine redraw_children(time_now)
    implicit none

        real, intent(in)::time_now
        integer::i

        do i = 1, max_windows
            call redraw_child(i, time_now)
        end do

    end subroutine redraw_children
The above routine isn’t particularly interesting. For each possible window, it calls a far more interesting subroutine, redraw_child:
    subroutine redraw_child(child_index, time_now)
    use appgraphics
    implicit none

        integer, intent(in)::child_index
        real, intent(in)::time_now
        integer::child_id
        character(40)::text
        integer::longevity
        integer::previous_current

        ! Get the child id from our array
        child_id = child_ids(child_index)
        if(child_id .GE. 0) then

            ! If its create time is zero, store the system time now
            if(child_create_time(child_index) .EQ. 0.0) then

                child_create_time(child_index) = time_now
                longevity = 0

            ! Otherwise, calculate the difference in times
            else

                longevity = int(time_now - child_create_time(child_index))

            end if

            ! Write out how old this window is
            write(text, '(A19,1X,I4,1X,A7)') "I've been alive for", &
                                             longevity, &
                                             "seconds"

            !  Store the "current" window for good measure
            previous_current = getcurrentwindow()

            ! Select this window as current and display the text in the window
            call setcurrentwindow(child_id)
            call clearviewport()
            call outtextxy(10, 10, text)

            !  Reset the current window to its previous state
            call setcurrentwindow(previous_current)

        end if

    end subroutine redraw_child
In the redraw_child subroutine, we first check that the id available in the child_ids array is greater than or equal to zero. Recall that a -1 in this array represents “no window” in our scheme. If the id is valid, we’ll proceed with drawing our window.
First, we can calculate, based on the time passed in, how long our window has been open. If a 0.0 is stored in child_create_time, we’ll store the passed time and say that our window has existed for 0 seconds. Otherwise, we can compute how long the window has existed by determining the difference between the current time and the stored time. We’ll use this time to prepare a string to display that states how long the window has been opened.
We’re now ready to draw our window. First, we’ll set our current window appropriately since we’re about to draw. However, prior to doing so, we’ll actually save the current window id in case we were sloppy elsewhere so that we can reset the current window when we’re done. Next, we can clear the window with a call to clearviewport. Then, we can output our text to the window. Finally, before leaving our drawing routine, we’ll reset the current window to its original state like the responsible bookkeepers we should be.
The result of all these routines leads to an interesting example program:

While this example might seem complex, users can hopefully decipher all the steps taken. Furthermore, creating muk\ltiple window applications is an inherently complex process, and we’ve tried to make such development as simple as possible.
The source code for the example appears below:
A “Progress Bar” in AppGraphics
Posted: April 15, 2015 Filed under: AppGraphics, Tips and Tricks Leave a commentA user on our forums posted a question about creating a progress bar using AppGraphics. Because Fortran is often relied upon for long-running computations, a graphical progress bar could be very useful. While AppGraphics doesn’t provide a progress bar solution out of the box, creating one isn’t particularly difficult.
In it’s simplest form, a progress bar is really just a partially filled rectangle. With a little creativity, we can create a window that provides all the progress bar behaviors we might want. For maximum portability, we’ll assume that we want a standalone window that can display progress. Ideally, it should also provide:
- An optional “Cancel” button
- A way to display text
- A simple 0 to 100 percent update mechanism
For fun, we’ll also design our progress bar window to be Fortran-2003-esque using some type-bound procedures. To start, we need a derived type to describe our progress bar:
    type progresswindow

        integer::win
        integer::cancel

        character(128)::text

        contains

        procedure :: close => closeprogress
        procedure :: draw  => drawprogress

    end type progresswindow
The type includes integers that refer to our progress window, a possible cancel button, and the text we’re displaying above the progress bar. We’ve also attached two type-bound procedures: a “close” subroutine and a “draw” subroutine.
To initialize this window, we’ll basically just need to create the window and set up some drawing styles. An abbreviated summary is below:
        p%win = initwindow(400, 100, title=title, dbflag=.FALSE., closeflag=.FALSE.)
        call setbkcolor(systemcolor(COLOR_WINDOW_BKGD))
        call setcolor(BLACK)
        call settextstyle(WINDOWS_FONT, HORIZ_DIR, 10)
        call setfillstyle(SOLID_FILL, RED)
The above code creates a window, configures some colors and fonts to match Windows defaults, and sets up the fill style for a red progress bar.
The first type-bound procedure, close, is exceptionally simple, needing only to close this window, so we’ll skip that for now. In contrast, drawing the window is a bit more involved. We’ll need to take a number of steps. Our type definition pointed to a routine “drawprogress,” which we’ll define as such:
    subroutine drawprogress(p, completed, text)
    use appgraphics
    implicit none

        class(progresswindow), volatile::p
        integer, intent(in)::completed
        character(*), intent(in), optional::text

        ...
The drawing routine requires a completed percent, which is assumed to be 0 to 100, to be passed in. Optionally, the developer can also provide an updated text string to display above our progress bar. If the text is passed in, we’ll overwrite the text that our “progresswindow” variable is currently storing before we proceed with drawing.
First, we need to clear our viewport of existing graphics with an appropriate call:
    call setcurrentwindow(p%win)
    call clearviewport()
Note that prior to clearing the viewport, we’ve set the current AppGraphics window. This operation safeguards against applications where we may have multiple windows present. The developer, however, must be careful to switch windows back to any other windows when necessary.
Next, we can output the text into the window:
    if(len_trim(p%text) > 0) then
        call outtextxy(5, 5, trim(p%text))
    end if
If the text length is zero, we actually skip that step. Finally, we need to draw the progress bar. The actual progress bar really has two components: an empty rectangle and a filled rectangle whose size relative to the empty rectangle reflects the percent complete. AppGraphics doesn’t actually provide a quick routine for drawing unfilled rectangles, so we’ll instead use the relative line operations:
    progress_total = getmaxx() - 10

    ! Below we'll draw a simple box, unfilled
    call moveto(5, 25)
    call lineto(progress_total+5, 25)
    call lineto(progress_total+5, 50)
    call lineto(5, 50)
    call lineto(5, 25)
While the vertical coordinates aren’t particularly important, one should note that the empty rectangle should be about as wide as our window less five pixels on each side as a margin. Next, we can compute the width of filled rectangle based on what the developer passes into the drawing function:
    ! Bounds-check our completed value
    progress_completed = progress_total*completed/100
    if(progress_completed > progress_total) then
        progress_completed = progress_total
    elseif(progress_completed < 0) then
        progress_completed = 0
    end if
One additional step we’ve taken above is to ensure that the final width does not exceed the maximum width of our empty progress bar or that a negative with result from the user’s value. Once we have a width based on our completed progress, we can draw a filled bar:
call bar(5, 25, progress_completed+5, 50)
This rather simple progress bar is actually quite effective. To test out how well it works, we can use a simplistic timing demo to watch the bar draw itself:
program main
use progress
implicit none

    type(progresswindow), volatile::p
    integer::counter
    real::last_time, now_time

    p = initprogress("Timed Progress")

    call cpu_time(last_time)
    now_time = last_time

    counter = 0

    do while(counter < 100)

        do while(now_time - last_time < 0.2)
            call cpu_time(now_time)
        end do

        last_time = now_time
        counter = counter + 1

        call p%draw(counter)

    end do

    call p%close()

end program main
Because of our use of type-bound procedures, the actual driver routine is rather clean.
If you want to try out this simple progress bar, you can download the actual progress bar module and a slightly more advanced driver program (it implements a cancel button) below:
Creating “Dialogs” from AppGraphics
Posted: March 9, 2015 Filed under: AppGraphics, Tips and Tricks | Tags: AppGraphics, Fortran, GUI Leave a comment
A simple program in AppGraphics
AppGraphics is a simple graphics library designed for creating graphical user interfaces from Fortran. Although based on an older drawing library, AppGraphics has ben enhanced with a number of Windows controls, or the standard buttons, text boxes, check boxes common in modern Windows applications. While AppGraphics can be used for drawing shape primitives, it can also be used to easily create a “dialog” experience.
In this quick rundown, we will create a simple application for converting common temperature formats in a simple graphical program written entirely in Fortran. Since our task is so simple, we’ll only need a single Fortran source file to build this.
In our main program, the first step is to initialize our window. For this example, we’ll create a long, skinny window as shown in the picture:
integer::myscreen

...

myscreen = initwindow(150, 255, title="TempConvert", closeflag=.TRUE.)
We now have a 150 by 255 pixel window with an appropriate title. The closeflag argument instructs AppGraphics to end our program whenever the window closes. To make our window match the operating system’s themes, we’ll need to also change the background. The proper action would be to set the background color to the system’s dialog background color:
call setbkcolor(systemcolor(COLOR_WINDOW_BKGD))
We also need to make sure our fonts match Windows as one would expect:
call settextstyle(WINDOWS_FONT, HORIZ_DIR, 10)
Finally, we need to redraw our background with the newly assigned background color by clearing the window and forcing a redraw:
call clearviewport()
After combining all of the above code, we should now have a standard blank window with the proper fonts configured. If you want to see everything together, you’ll be able to download the complete program at the end of this article.
Next, we need to add our controls to the window. First, we’ll add the text box where a user can enter a temperature:
original = createtextbox(5, 5, 140, 20)

call settextboxcontents(original, "32.0")
Above we’ve created a text box at (5,5) (as measured from the top left) that measures 140 pixels wide and 20 pixels high. These dimensions should leave a consistent 5 pixel distance from the top, left, and right edges of our window. Next, we drop in the temperature of 32 degrees.
We now need to provide a method to select the original temperature’s units of measure. Since only one unit can be chosen, using radio buttons is an obvious choice of control. Using a 4-element array to store each radio button’s identifier, we can create our controls:
integer, dimension(4)::src, dest
character(16), dimension(4), parameter:: units =(/ 'Fahrenheit',  &
                                                   'Celsius   ',  &
                                                   'Kelvin    ',  &
                                                   'Rankine   ' /)
...
    call outtextxy(5, 30, "Original:")
    call beginradiogroup()
    src(1) = createradiobutton(50, 30, 95, 20, units(1))
    src(2) = createradiobutton(50, 50, 95, 20, units(2))
    src(3) = createradiobutton(50, 70, 95, 20, units(3))
    src(4) = createradiobutton(50, 90, 95, 20, units(4))
    call radiobuttonsetchecked(src(1), logical(.TRUE., 1))
The call to beginradiogroup indicates to AppGraphics that all radio buttons created until another call to beginradiogroup represent exclusive choices. If we click on the second button, for example, the first button will now unselect. Like the text box, the calls to createradiobutton specify the position and dimensions of our new buttons. Finally, we’ll select Fahrenheit for our initial temperature.
We’ll also need the possible selections for our final temperature, but the code to do so is extremely similar. For now, we’ll skip ahead to the buttons that actually get work done.
We need two buttons for this program, Convert and Close:
    ignore = createbutton(40, 230, 50, 20, "Convert", convert_temp)
    ignore = createbutton(95, 230, 50, 20, "Close", quit)
The createbutton call returns an integer that represents an identifier for the button. Since we don’t particularly care about the identifier in this program, we can assign the number to a variable named “ignore.” The first four arguments are, again, the position and dimensions of our buttons. The text arguments represent the text on the button when displayed. Finally, the last arguments are subroutines that will be called when a button is clicked. The latter subroutine, quit, is simple:
    subroutine quit()
    implicit none

        call stopidle()

    end subroutine quit
This subroutine makes sense if we examine the remaining segments of our main program.
After we create all our controls, we basically want the window to sit idle until the user clicks either “Convert” or “Close.” After we create our buttons, we can add two simple calls:
    call loop()
    call closewindow(myscreen)
In the code above, we’ve instructed our program to enter an idle “loop” until instructed to leave idle mode. As soon as stopidle is called, like in our quit subroutine, the program resumes execution at the next line. In this case, we’ll close our window and stop running.
The other button will call convert_temp, a substantially more complicated subroutine. The goal of convert_temp is to read the temperature in our original text box, determine its units of measure, convert to another unit system, and output the result in another text box.
First, we need to retrieve the original temperature:
character(40)::source_text, dest_text
real::source_number, dest_number

    i = gettextboxcontents(original, source_text)
    Read(source_text, *) source_number
in the code above, we read in the text box contents into a string and then read in a number from said string.
Next, we would need to determine the source temperature’s units. This step gets somewhat complicated because we have four possibilities. The full program is a better place to see all the calls. However, one simplifying step might be to convert an original temperature in Kelvin to Celsius and, similarly if appropriate, in Rankine to Fahrenheit.
    ! Check if we have kelvin or rankine and correct to
    ! celsius or fahrenheit
    if(radiobuttonischecked(src(3))) then
        source_number = source_number - 273.15
    elseif(radiobuttonischecked(src(4))) then
        source_number = source_number - 460.67
    end if
The code above checks if the Kelvin radio button is selected using the call radiobuttonischecked, and, if so, converts our source temperature to Celsius immediately. If Rankine is selected, a similar computation occurs to convert the temperature to Fahrenheit.
After we check all the combinations and perform the proper math, we can store our result in the appropriate text box:
    Write(dest_text, '(F10.2)') dest_number
    call settextboxcontents(converted, trim(adjustl(dest_text)))
Once we set the results textbox with the converted temperature, we can exit our convert_temp subroutine. Notice that we never called stopidle; that call would have ended our program. Instead, we can continue to allow our program to idle in case the user wants to click “Convert” again.
And that’s about it! The hardest part of the code above is properly laying out our Windows controls. The best way to do so is trial and error, but it becomes substantially easier with experience.
You can download the full code for this example here:
Constructing import libraries
Posted: October 3, 2013 Filed under: Tips and Tricks Leave a commentA user just posted an excellent question/bug to our user forums. Basically, the user was attempting to link a DLL to another DLL created by Simply Fortran, and there were some issues related to the linker finding the first library. The user was attempting to have the linker automatically find the DLL for linking, and Simply Fortran wasn’t cooperating. He used the prescribed linker flag -lone to specify that the library libone should be linked to in his second project, but the only product of the libone project was libone.dll.
The resolution was to create a true import library in the libone project. An import library will just contain a listing of the exported symbols available in the shared library, libone.dll. Currently (as of version 2.3) Simply Fortran does not automatically create import libraries when building DLLs, but it probably should do so in the future to make everything easier.
In the meantime, creating an import library is still pretty straightforward. In any DLL project, you can instruct the linker to output a GNU-compiler-compatible import library by adding a flag under Project Options. In the image below, I’ve already done so:

In the options, I’ve set my Target Name to libone.dll as I described earlier. Under Project Flags, I’ve also added an additional flag to the default flags set up by Simply Fortran:
-Wl,–out-implib=libone.dll.a
The flag above is simply asking the linker directly (hence the -Wl, prefix) to generate an import library named libone.dll.a. When I clean and build my project, I now should see libone.dll and libone.dll.a in my project’s root directory.
To use this import library in other projects, I now need to use a slightly different flag in the linker options. If I were linking to a static libone.a library, the flag -lone would be sufficient. In this case, however, I want to use libone.dll rather than statically linking to an equivalent library. Therefore, if I’ve created my import library as described, I would instead use the flag -lone.dll. Now the linker will load and link to libone.dll.a, but the resultant project will require and use libone.dll.
The important bit of information that came out of this bug report is that Simply Fortran probably should handle creating import libraries automatically. Most every other compiler package on Windows does so in order to make life easier for users, and we of course want to do the same.


Recent Comments